

Built for growers · citrus-proven
Agroview: tree counts, gap analysis, and nutrient maps for your grove
Objective tree and gap counts, canopy metrics, and full-field nutrient insight where bands support it. Upload your own imagery or we coordinate collection. The gap problem is simple for any tree crop: no tree, no yield.
Gap loss estimator
Every gap is lost revenue
Missing trees drain yield every season. Dial in your grove below and see what gaps may be costing you. Works for citrus and other tree crops: no tree, no yield.
How this is calculated: acres × trees per acre × gap rate = missing trees; missing trees × boxes per tree × price per box = revenue lost each year.
The 6% default is deliberately conservative. Across the millions of Florida citrus tree spaces Agroview has assessed, the average gap rate is 19.8%. More on orchard gap analysis.
How it works
1. Bring or collect imagery
Upload your own imagery, arrange a drone (UAV) flight, or use aircraft + Agrozoom for scale and history.
2. Count and measure every tree
Cloud ingest and models turn pixels into per-plant and per-field metrics.
3. Act and share
Maps, reports, and exports your team, advisors, or buyers can use.
Need ground-level data too? Agrosense (early access) adds trunk diameter and visible fruit, tree by tree, from the row.
- Deficient
- Low
- Optimum
- High
- Excess
Beyond the census
Nutrients mapped across the whole field
Nutrient status shows in the canopy. Agroview reads it from multispectral drone imagery, RGB plus two bands beyond what the eye can see, and zones the whole block from deficient through optimum to excess. You get every non-optimal zone on the map, not just the trees you sampled, so corrections go where they bring the balance back. NPK plus eight micronutrients, each as its own map. Available for citrus today.
Macronutrients · NPK
- NNitrogen
- PPhosphorus
- KPotassium
Micronutrients
- Magnesium
- Calcium
- Sulfur
- Boron
- Zinc
- Manganese
- Iron
- Copper
Quoted separately from the inventory package; needs a multispectral flight, not RGB. More on nutrient mapping.
Pricing
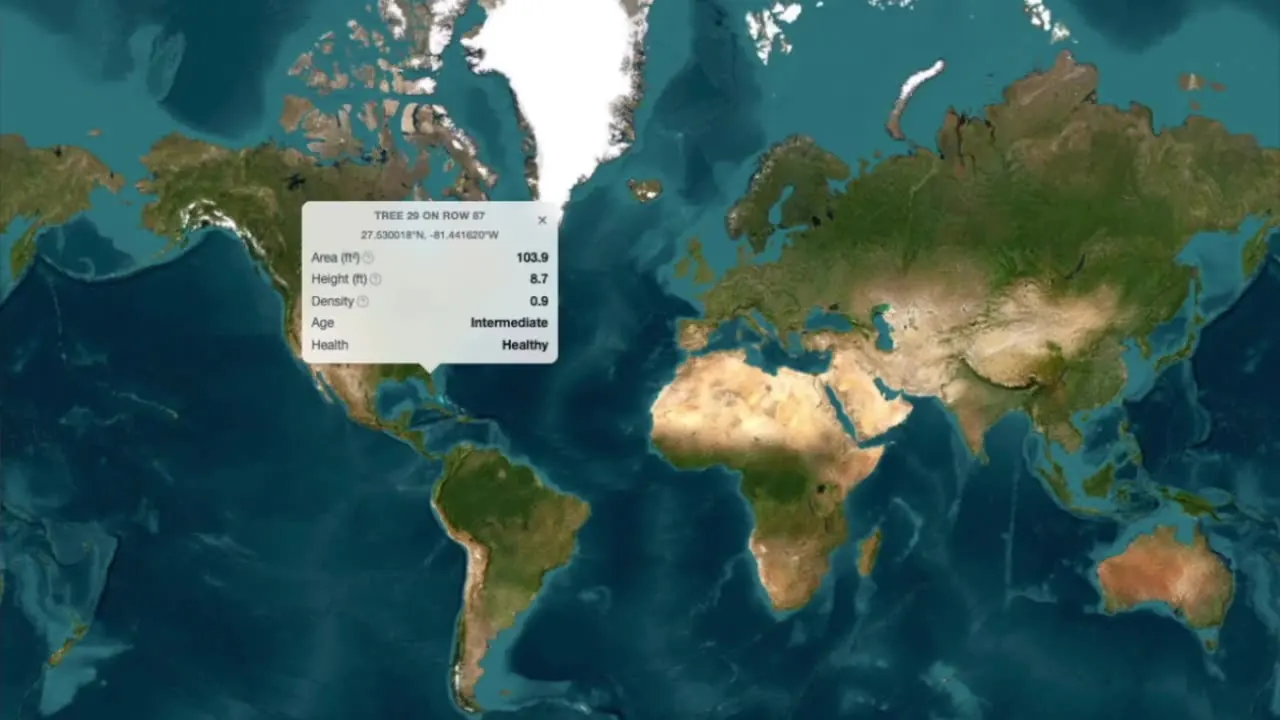
One annual inventory price by acre band. Aircraft imagery + Agrozoom, then Agroview analysis: tree count, gap count and report, and per-tree metrics (height, canopy area, leaf density).
Small
Under 100 acres
$1,353/yr
- Aircraft + Agrozoom imagery
- Tree count and gap count / report
- Per-tree height, canopy area, leaf density
Medium
101–850 acres
$3,498/yr
- Aircraft + Agrozoom imagery
- Tree count and gap count / report
- Per-tree height, canopy area, leaf density
Large
851–2,500 acres
$6,748/yr
- Aircraft + Agrozoom imagery
- Tree count and gap count / report
- Per-tree height, canopy area, leaf density
Pay-as-you-go analytics
Need nutrients, extra analysis, or a different collection path? We quote those separately. Talk to us when the inventory package is not the whole job.
Larger operations and crop insurers: see the insurer path or talk to us.
Ready to put a number on your gaps?
Dial the estimator above, or talk to us about a free analysis on your acres.